
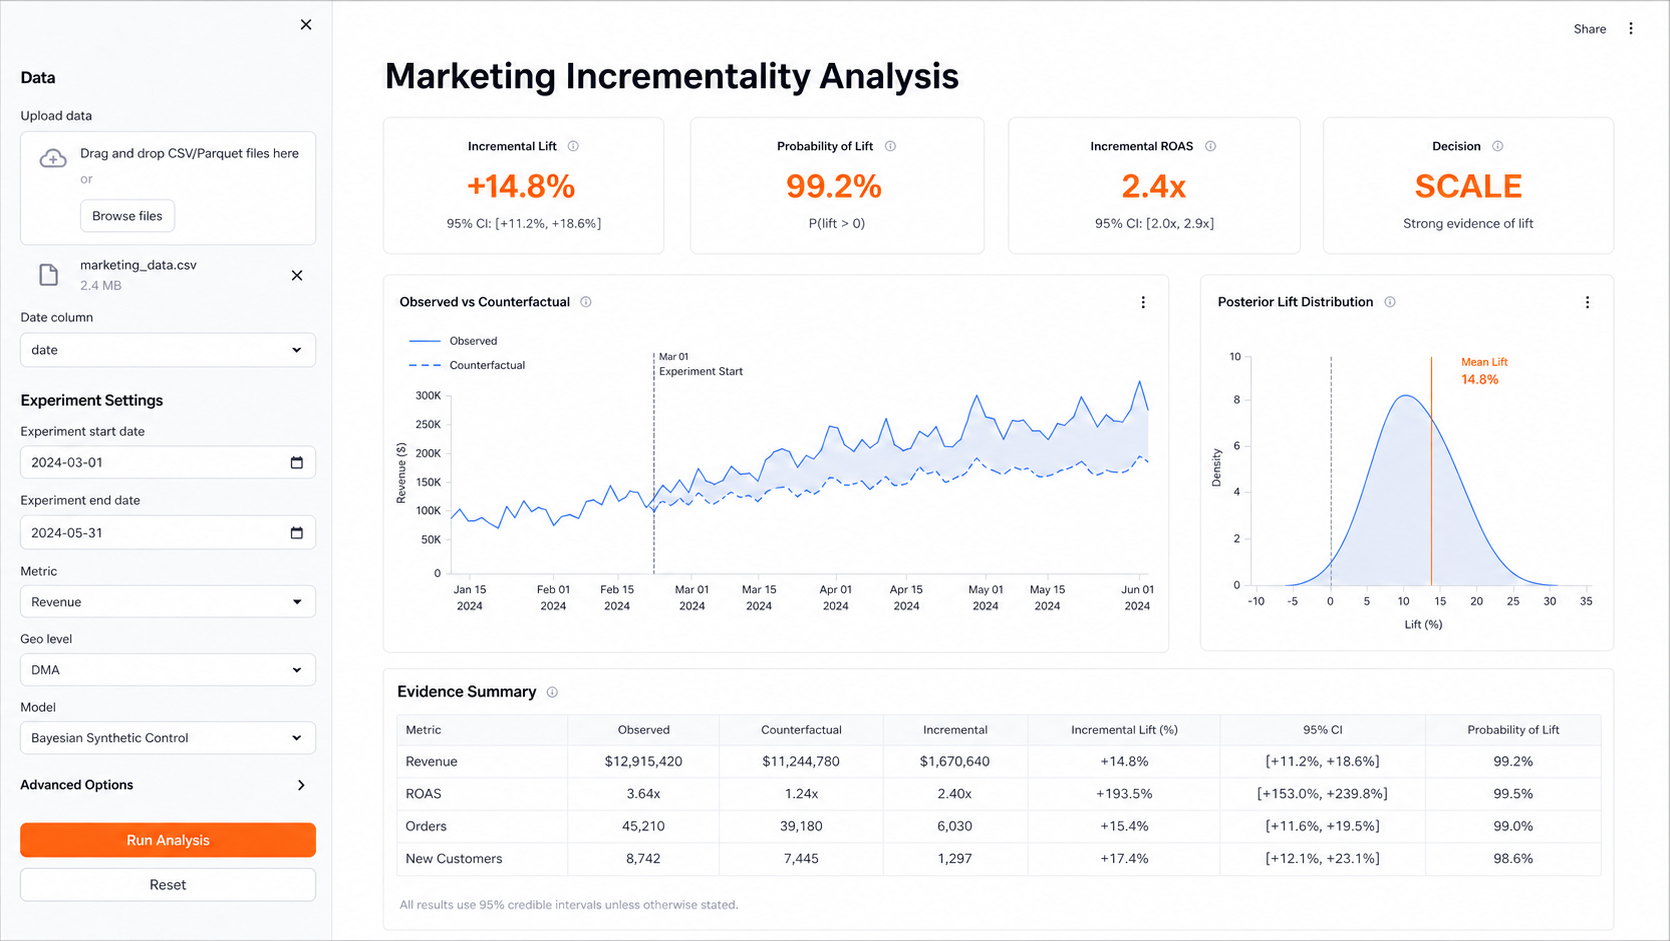
Every second, the global advertising industry places approximately $22,000 in digital ad spend. By any measure, this is the largest real-time allocation system in human commercial history. And the fundamental question underneath every dollar (”is this working?”) is answered with methodology borrowed from a world that no longer exists.
I built OpenLift to fix that.
This is the technical case for why multi-touch attribution is structurally broken, what replaces it, and why the replacement is now production-ready and open source.
The Wrong Question
The dominant measurement paradigm, multi-touch attribution (MTA), assigns fractional credit to touchpoints along a customer journey. Last-click, first-click, linear, time-decay, data-driven. These are all variants of the same question: given that a conversion happened, which ads deserve credit?
The question sounds reasonable until you realize it is the wrong question entirely.
The correct question is: would this conversion have happened without the ad?
That is a counterfactual question. Counterfactuals cannot be answered by observational data alone. They require causal inference.
Attribution tells you who was present at the crime scene. Incrementality tells you who committed the crime.
The consequences of getting this wrong are not abstract. Advertisers scaling campaigns on platform-reported ROAS of 4x may be generating true incremental ROAS of 0.8x. Destroying value while every dashboard signals success. Studies comparing platform MTA to randomized controlled holdout experiments consistently find the same result: platform attribution overstates incrementality by 2 to 5x.
That is not a rounding error. That is a structural lie baked into the measurement layer.
Why Attribution Fails: A Mathematical Autopsy
MTA has two failure modes that no amount of machine learning can fix, because they sit inside the problem formulation itself.
The Fundamental Problem of Causal Inference. For any individual, you observe either the outcome with the ad or the outcome without it. Never both. This was formalized by Holland in 1986 and it hasn’t changed. MTA computes a conditional expectation (what happened given someone saw an ad and converted) and calls it a causal effect. It is not. It conflates selection bias with lift.
The Retargeting Trap. Consider retargeting. Ads are shown to users who already visited your site. These users already have high purchase intent. When they convert, attribution credits the retargeting ad. But the counterfactual (would they have converted anyway?) is almost certainly yes for many of them. The “lift” from retargeting is largely a measurement artifact.
The data backs this up. Across industry holdout studies, the gap between platform-reported ROAS and true incremental ROAS looks roughly like this:
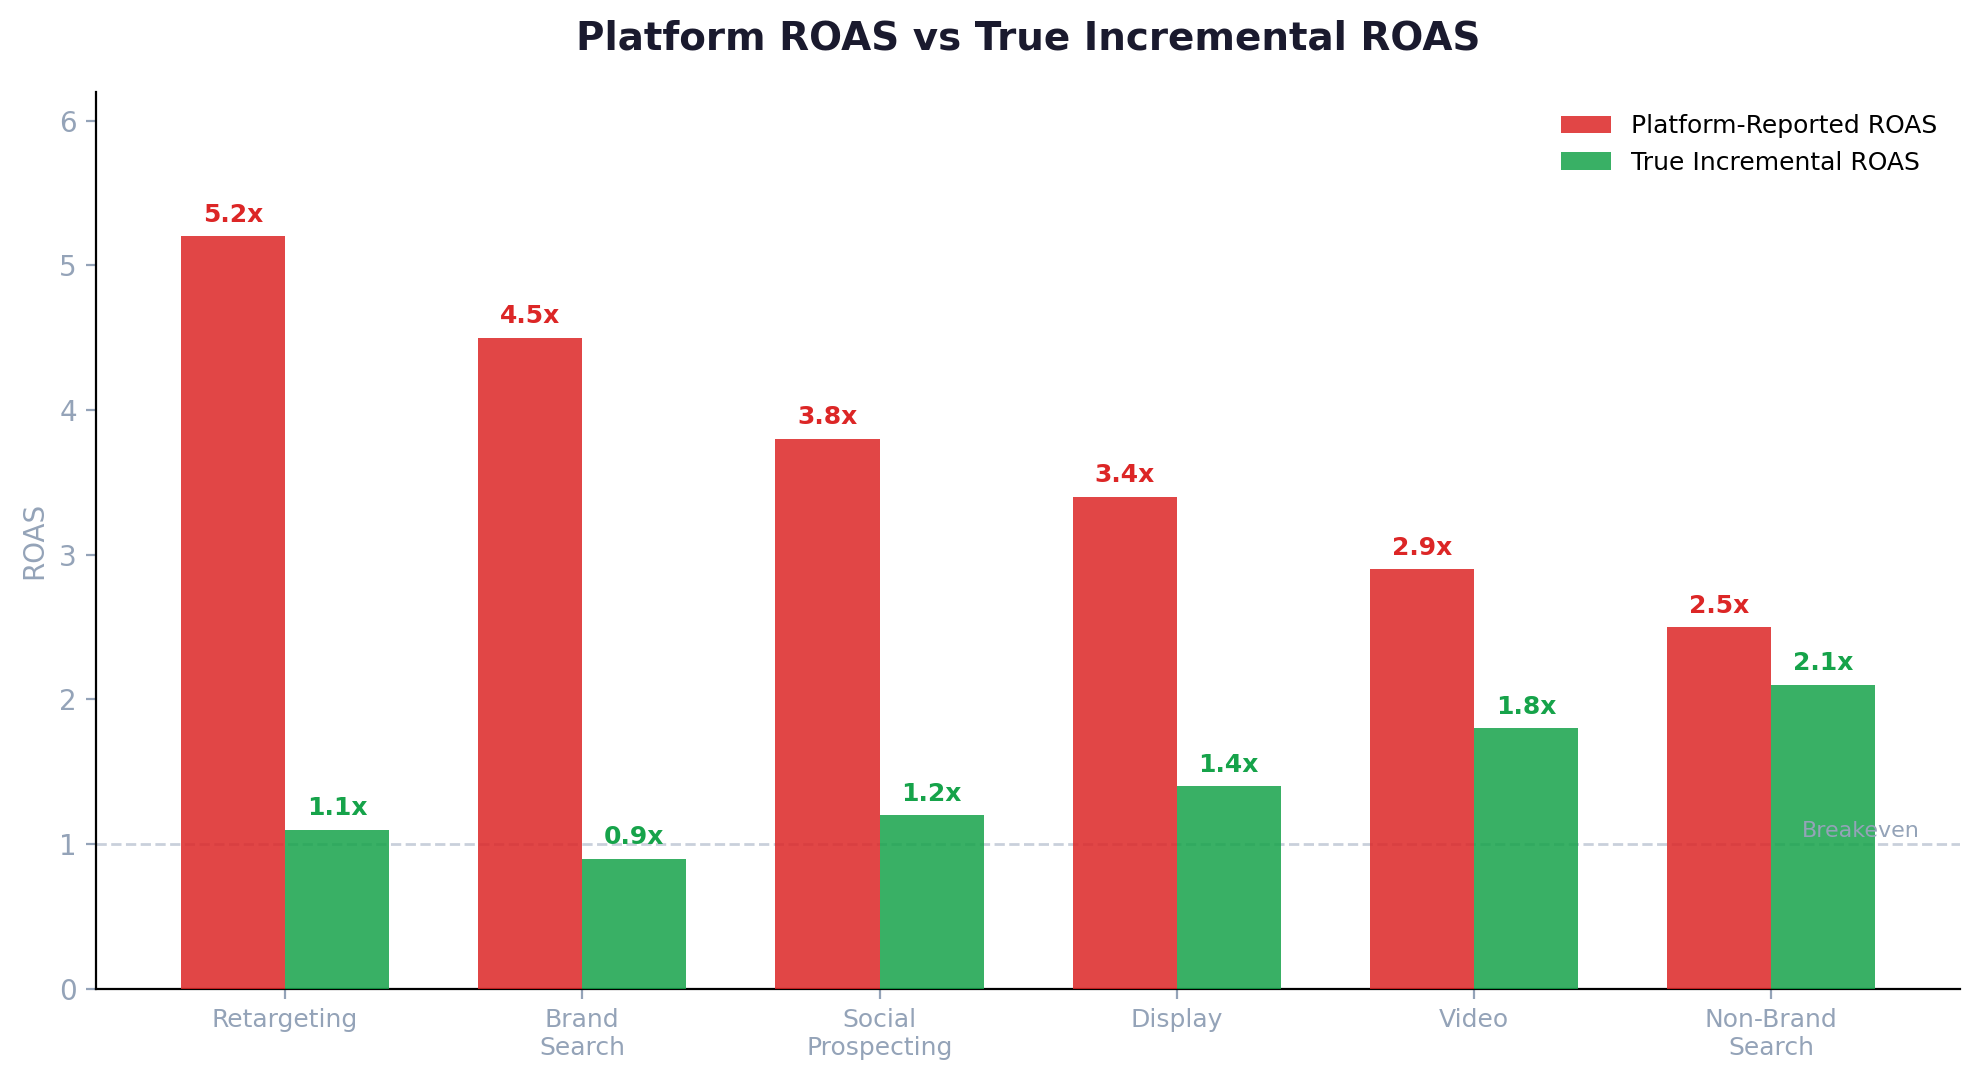
The pattern is consistent: the channels that look best in attribution are the ones with the largest inflation. Retargeting, where you are literally advertising to people who already want to buy, shows the biggest gap. Non-brand search, where the ad is actually causing discovery, shows the smallest.
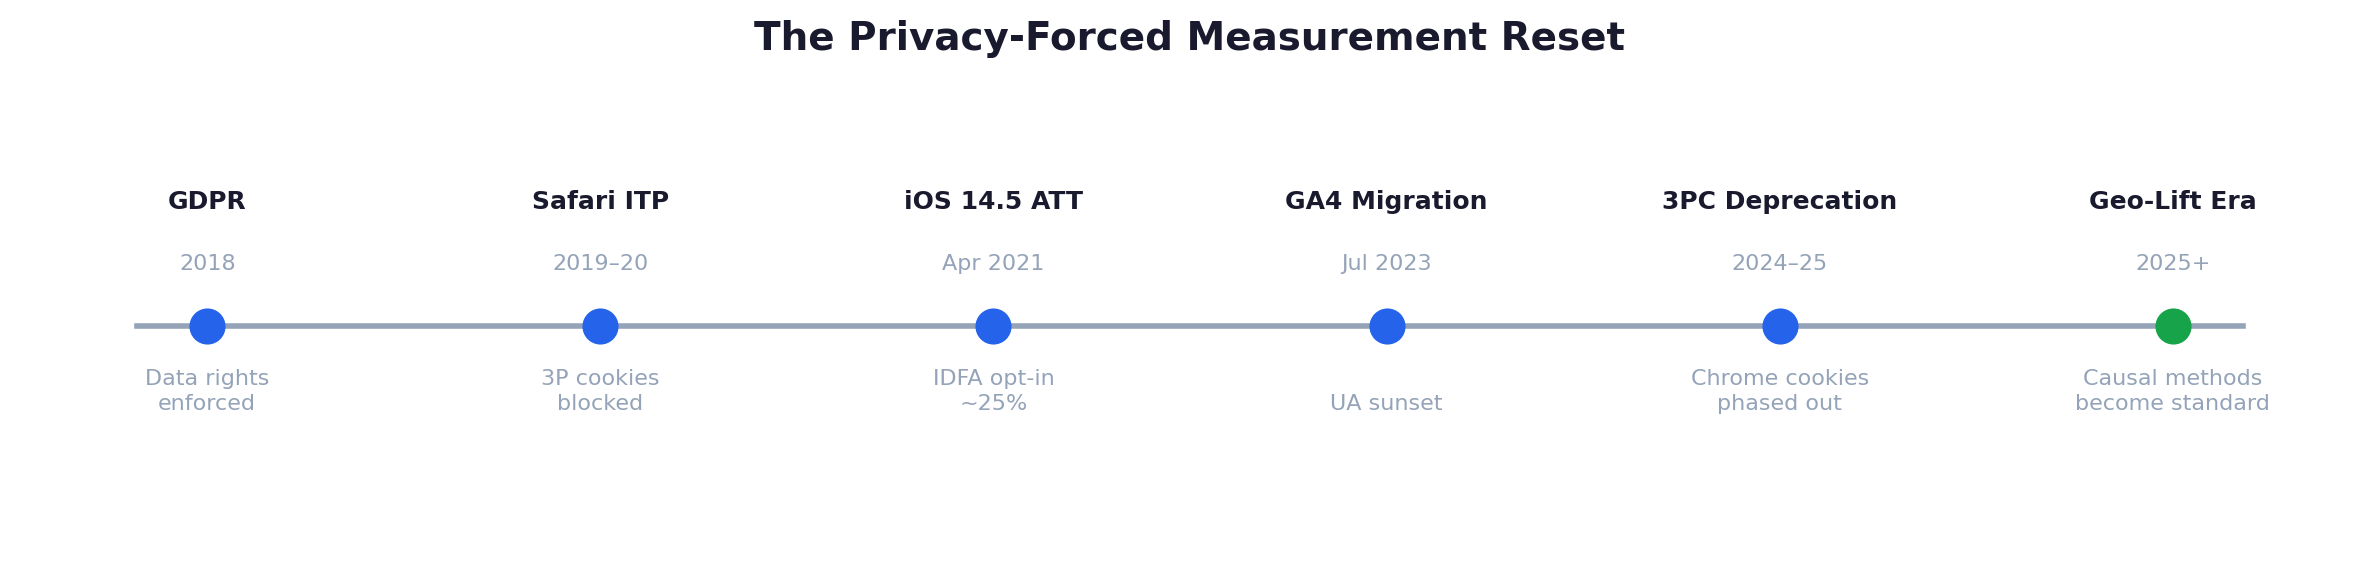
And it gets worse. Safari’s ITP, Chrome’s CHIPS partitioning, iOS 14.5 ATT, and third-party cookie deprecation have destroyed the user journey graph that MTA relies on. By 2025, a typical e-commerce brand running deterministic MTA has observable journeys for roughly 20 to 35% of converters. The model is extrapolating from a systematically biased sample of a population it was already measuring wrong.
The Replacement: Bayesian Synthetic Control
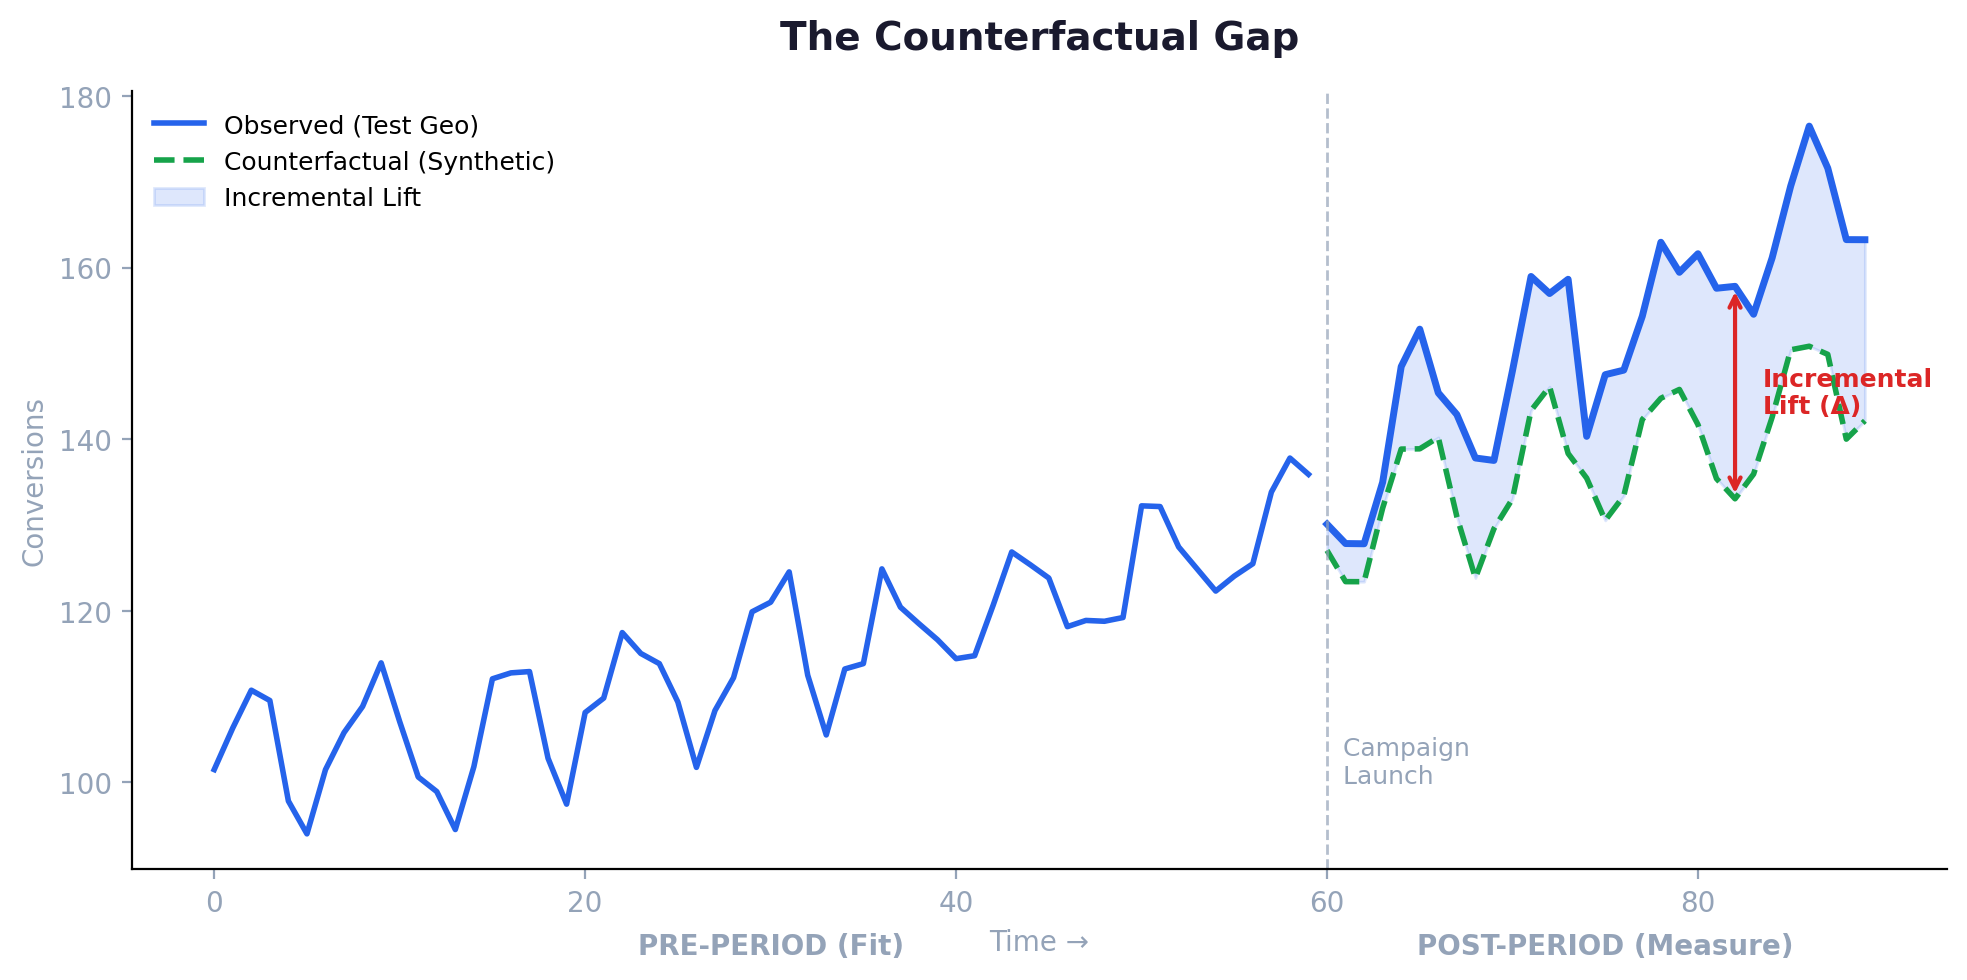
OpenLift implements a Bayesian Synthetic Control. The core insight: find a weighted combination of control markets that closely tracks the test market before the campaign, then use that synthetic control as the post-campaign counterfactual.
In plain terms: if I run a campaign in Dubai, I find a blend of other markets (Abu Dhabi, Sharjah, Ajman) whose conversion patterns closely mirror Dubai’s behavior before the campaign launched. After the campaign, the gap between what Dubai actually did and what the synthetic Dubai would have done is the incremental lift.
The model uses a Student-t likelihood (heavier tails than Gaussian), which makes it robust to the promotional spikes, attribution storms, and data ingestion errors that would catastrophically bias a standard regression. Day-of-week effects are modeled explicitly. Priors are regularized and data-adaptive.
The output is not a point estimate. It is a full posterior distribution over lift. You get:
Median lift (the central estimate)
90% Highest Density Interval (the shortest interval containing 90% of the posterior probability)
P(lift > 0) (the probability the campaign had any positive effect at all)
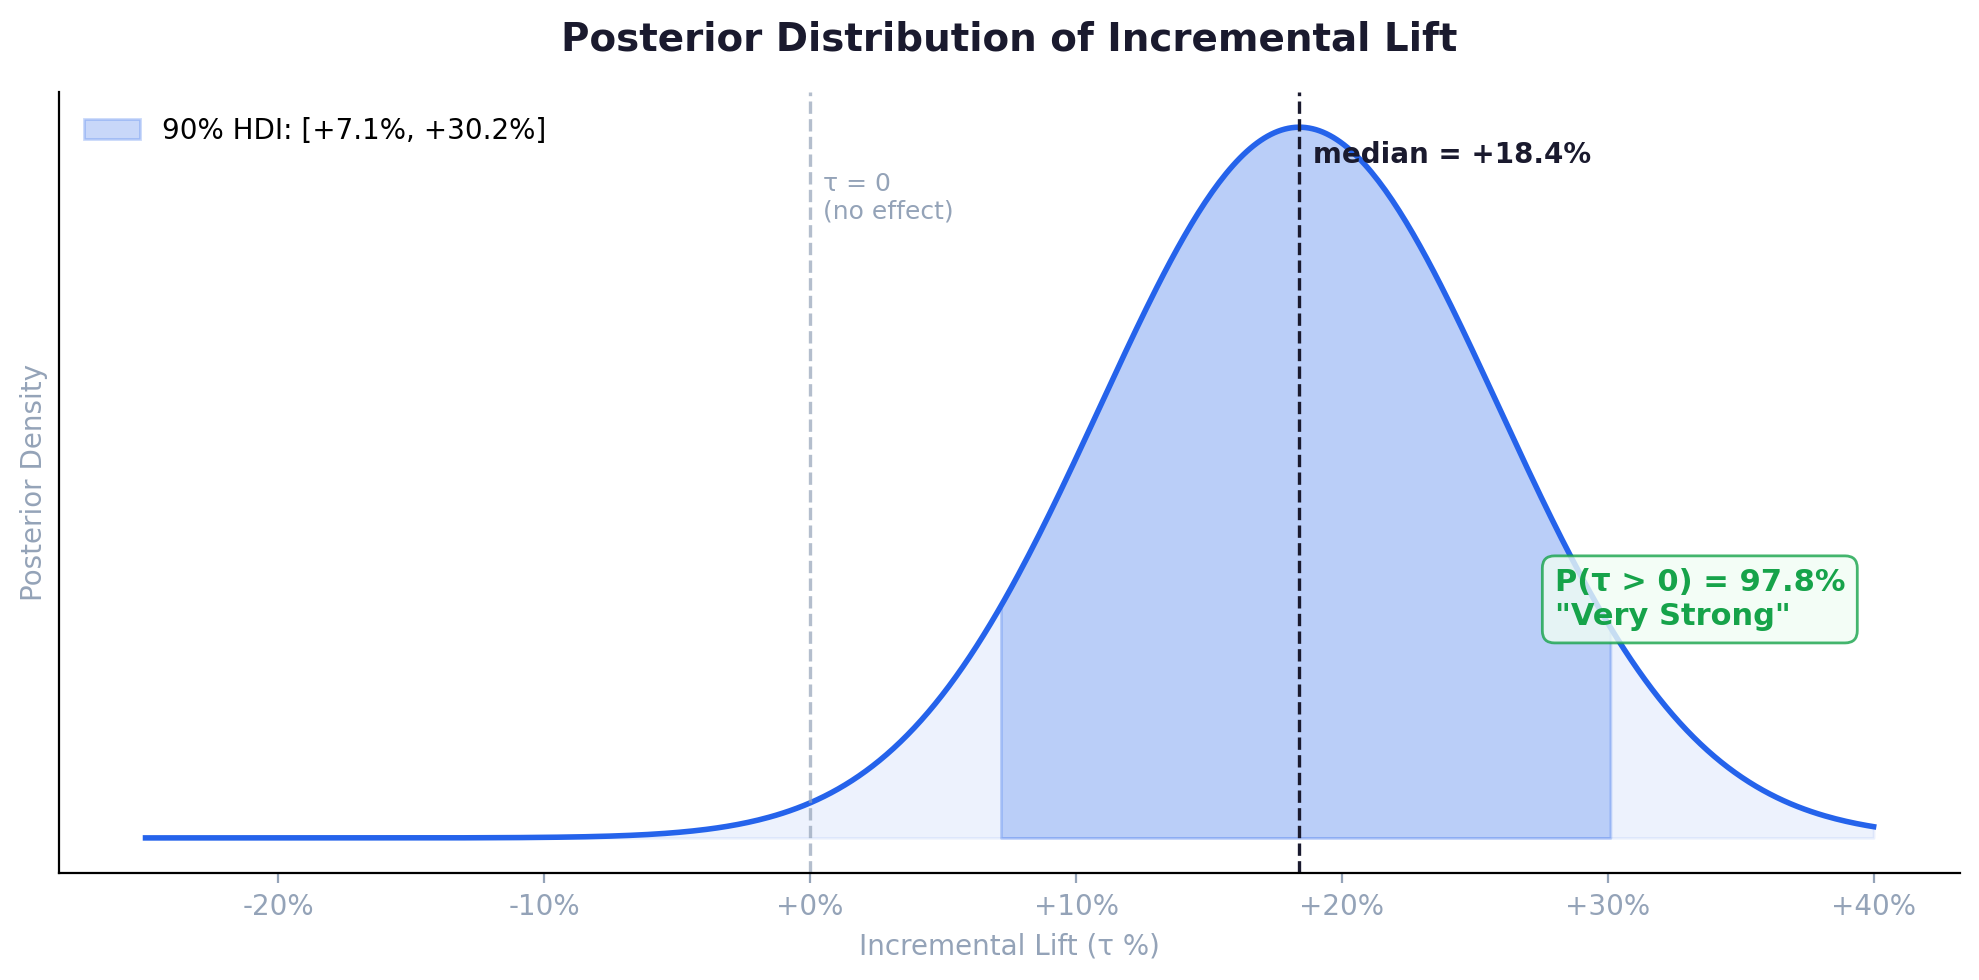
Unlike a frequentist confidence interval, the HDI directly answers: “there is a 90% probability that the true lift lies in this range.” That is the statement marketers think confidence intervals make. It is not. Bayesian credible intervals actually make it.
Geo Selection: Why It Matters More Than the Model
The quality of the synthetic control depends entirely on how well the control geos track the test geo before the campaign. OpenLift uses Dynamic Time Warping (DTW) distance as the similarity metric.
Why DTW over simple correlation? Because correlation measures linear relationship at fixed lags. Two geos with identical conversion trajectories but one slightly phase-shifted (a market where weekends drive conversions a day later) will show low correlation but near-zero DTW distance. DTW finds the optimal alignment by warping the time axis within a constrained window.
Each candidate control gets a DTW score against the test market over a 90-day lookback. Geos above a threshold are excluded. This is non-negotiable. A well-calibrated posterior built on poorly matched control geos is worse than useless because it gives you false confidence.
Power Analysis: Design Before You Spend
The most common failure in marketing measurement is running an experiment that was never going to detect a real effect. Not because the effect was not there, but because the test was underpowered.
OpenLift’s power analysis module answers this before the campaign launches. Rather than assuming Gaussian errors and applying an analytic formula, it runs a Monte Carlo simulation: inject a synthetic effect into historical data, run the inference, check detection. Repeat. This captures the true correlation structure of the geo data.
The results are instructive:
A 10% lift requires approximately 28 days to achieve 80% power with 4 well-matched controls
A 5% lift requires 42+ days
A 20% lift is detectable in under 21 days
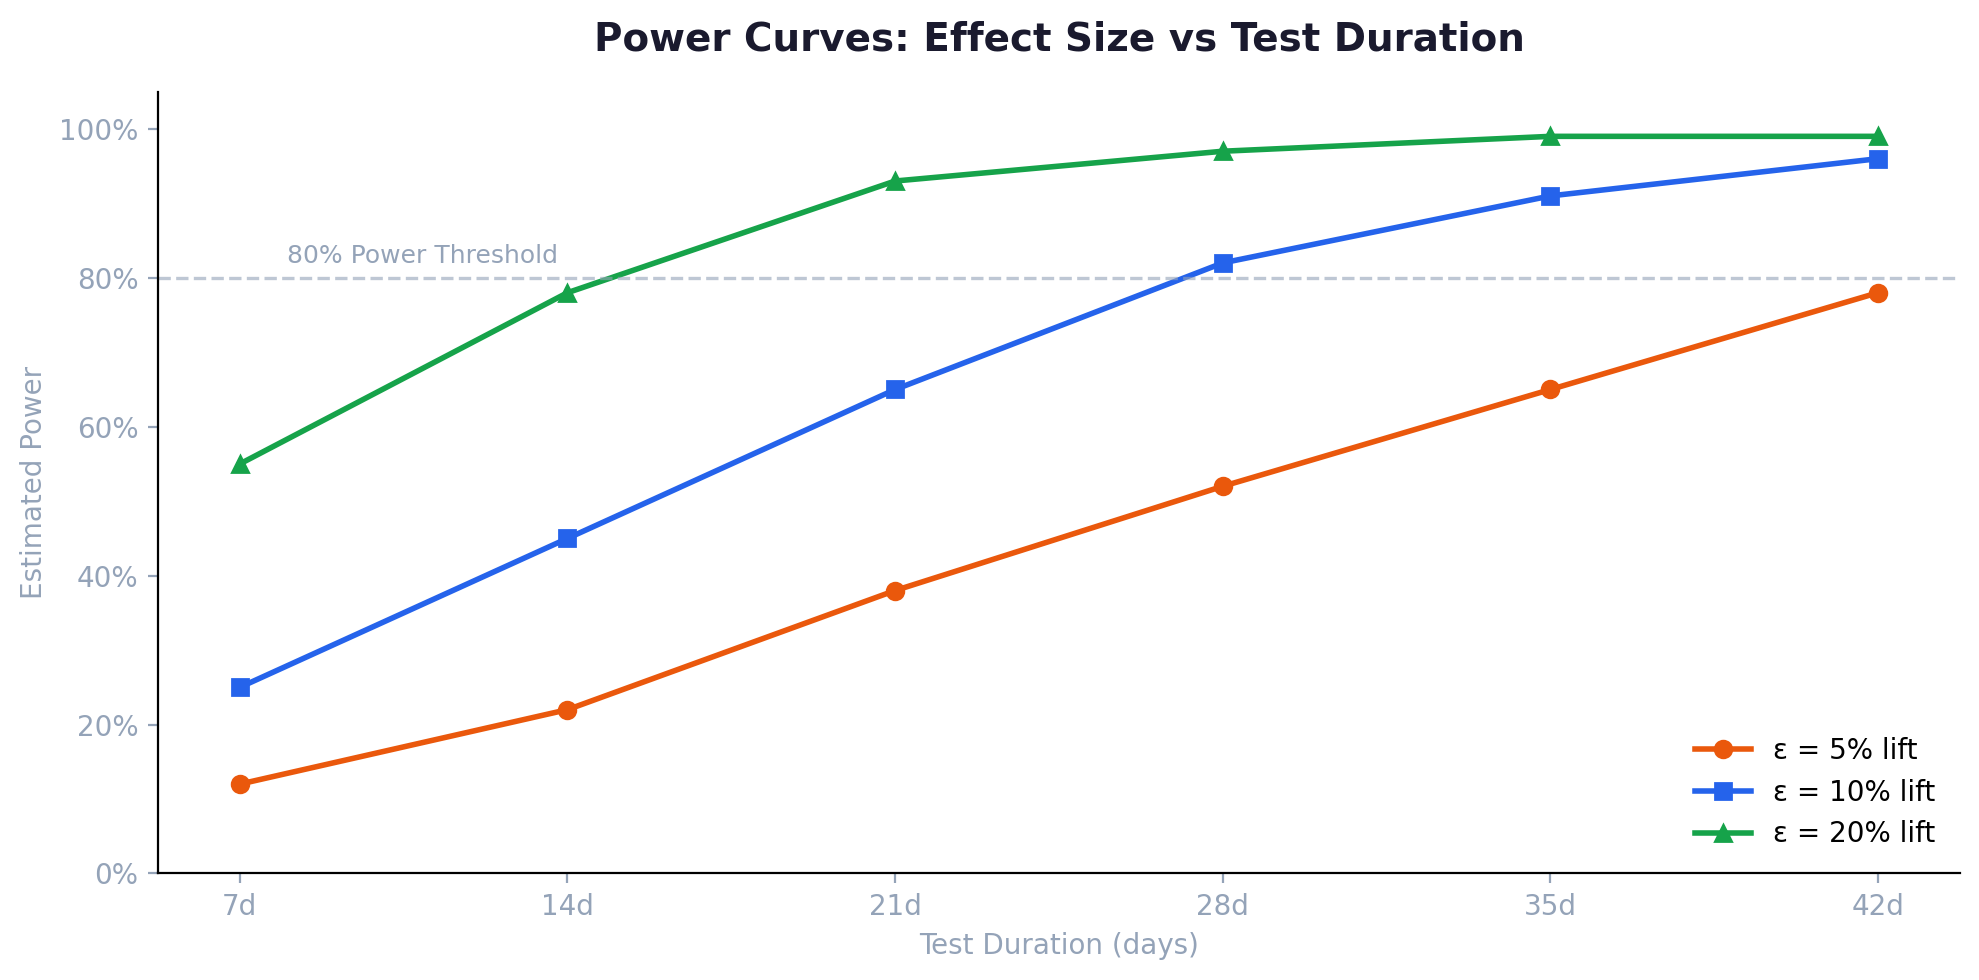
If you are running a 14-day geo test with 2 control markets trying to detect a 5% effect, you are wasting everyone’s time. The math says so before you spend a dollar.
Multi-Cell Experiments and Channel Synergy
Real marketing systems run multiple channels simultaneously. OpenLift’s multi-cell framework tests whether Channel A alone, Channel B alone, or A+B together produce different incremental effects. And whether the combination is super-additive.
The synergy index is straightforward:
Synergy = Lift(A+B) / (Lift(A) + Lift(B))
Greater than 1.0 means the channels amplify each other. Equal to 1.0 means independent effects. Less than 1.0 means diminishing returns or cannibalization.
This is the question every CMO asks (”do my channels work better together?”) and no attribution model can answer, because attribution cannot decompose causation. Geo-lift can.
The 5-Tier Evidence Framework
Raw posterior statistics require statistical training to interpret. P(lift > 0) = 87% is precise but not immediately actionable for a VP of Marketing deciding whether to reallocate $2M in budget.
OpenLift maps the posterior to five decision tiers:
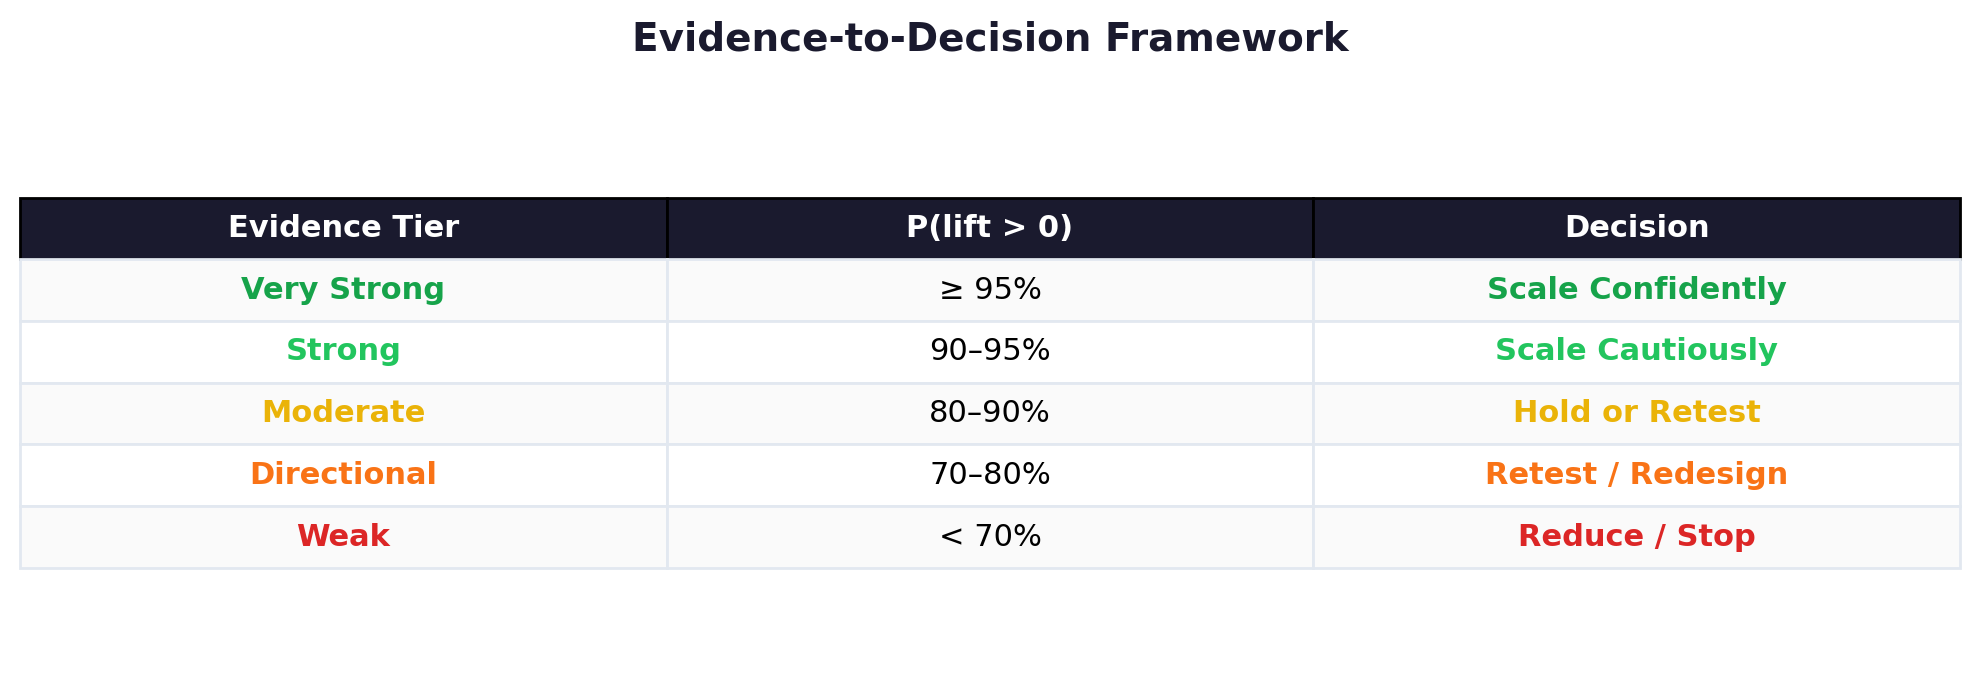
Critically, evidence strength gets downgraded if geo match quality is poor or if the credible interval is excessively wide relative to the mean. This prevents spurious “Strong” conclusions from well-calibrated posteriors built on poorly matched control geos.
The framework eliminates analysis paralysis. The posterior speaks directly to the business question.
Why Now
The statistical methods underneath OpenLift are not new. Synthetic Control was introduced by Abadie, Diamond, and Hainmueller in 2010. Bayesian computation has been theoretically tractable for decades. So why is 2025 to 2026 the inflection point?
Bayesian computation got fast. PyMC 5.x, built on PyTensor with JAX backend support, delivers MCMC performance that was unimaginable five years ago. A model that once took 45 minutes to fit on a mid-tier server now completes in 2 to 4 minutes on a MacBook Pro. The barrier dropped from “PhD in Bayesian statistics and a compute cluster” to “pip install pymc.”
Privacy killed the old way. iOS 14.5, GDPR enforcement, cookie deprecation, and ATT have not merely inconvenienced MTA. They have structurally broken it. Brands that relied on deterministic cross-device identity graphs have lost 60 to 80% of their observable user journeys. The industry is abandoning correlational attribution not by conviction but by data availability.
Emerging markets never had MTA in the first place. OpenLift’s geo-lift methodology works especially well in markets where user-level data was always sparse by design. In Sub-Saharan Africa, Southeast Asia, and Latin America, mobile-first consumers operate primarily through apps where deterministic attribution was always limited. Geo-level measurement provides the same quality signal in Lagos as in London.
The next trillion dollars of e-commerce growth will come from markets where MTA never worked in the first place.
LLMs remove the last adoption barrier. Bayesian credible intervals and posterior distributions are the right statistical objects for marketing measurement decisions. They have also historically required statistical training to interpret. OpenLift’s LLM integration converts posterior statistics into plain-language business recommendations. The statistics PhD is no longer a prerequisite for using the right methodology.
Empirical Validation
To validate calibration, OpenLift was tested against synthetic data where ground truth lift is known by construction. 200 experiments were simulated across varying effect sizes and geo counts. Key findings:
The 90% HDI achieves approximately 90% empirical coverage, confirming calibration
Estimation bias is consistently below 0.5 percentage points
Power at 30 days with 4 well-matched controls exceeds 80% for effects of 10% or greater
Dropping to 2 controls cuts power to 61%. Going to 8 controls pushes it to 94%
Poorly matched controls (high DTW scores) degrade both coverage and power
The model works. The question is whether the industry will adopt it at the scale the measurement crisis demands.
The Bottom Line
Marketing measurement is in crisis, and the crisis is not temporary. The user-level tracking infrastructure that underpinned a decade of performance marketing is being systematically dismantled. The causal validity of what remains was always questionable.
OpenLift is:
Statistically rigorous. Bayesian Synthetic Control with full posterior uncertainty.
Principled in design. DTW geo matching and simulation-based power analysis.
Decision-ready. 5-tier evidence framework mapping posteriors to business actions.
Globally applicable. Geo-level methodology that works regardless of cookie availability.
AI-augmented. LLM translation layer that removes the statistics expertise barrier.
Open source. MIT License. Production-ready.
In a world where platform-reported ROAS routinely exceeds true incrementality by 3 to 5x, causal truth is not a luxury. It is the difference between brands that scale what works and brands that scale what appears to work until the budget runs out.
OpenLift v3.0.0 is open source under the MIT License. The methodology is based on Abadie et al. (2010), Hoffman & Gelman (2014), and Brodersen et al. (2015).